
It's a bit of a mystery of what goes on inside your coffee grinder. You put your roasted beans in the hopper, dial in the grind setting, and start the motor. But what REALY matters is the end result in the form of coffee grinds. The art of matching your coffee grinds to your brewer comes with experience and trial and error.
The inspiration for writing this blog post came from problems I had with a new grinder and the weak coffee I was making using the same brew ratio I had used with my previous grinder. Visually, the grind size looked similar and after a couple days of getting consistently weak coffee I decided to do some investigation.
The image of grinds shown below was taken from my smartphone and converted to binary using a background threshold. Most notable are some large grinds and a wide variance of smaller grinds. I hadn't noticed the large chunking grinds until distributing them onto an index card for the photo. But even with a few of these large chunks I still could not imagine how they could make that much of a difference in the coffee strength. It was time to do some grind analysis to get to the bottom of this.
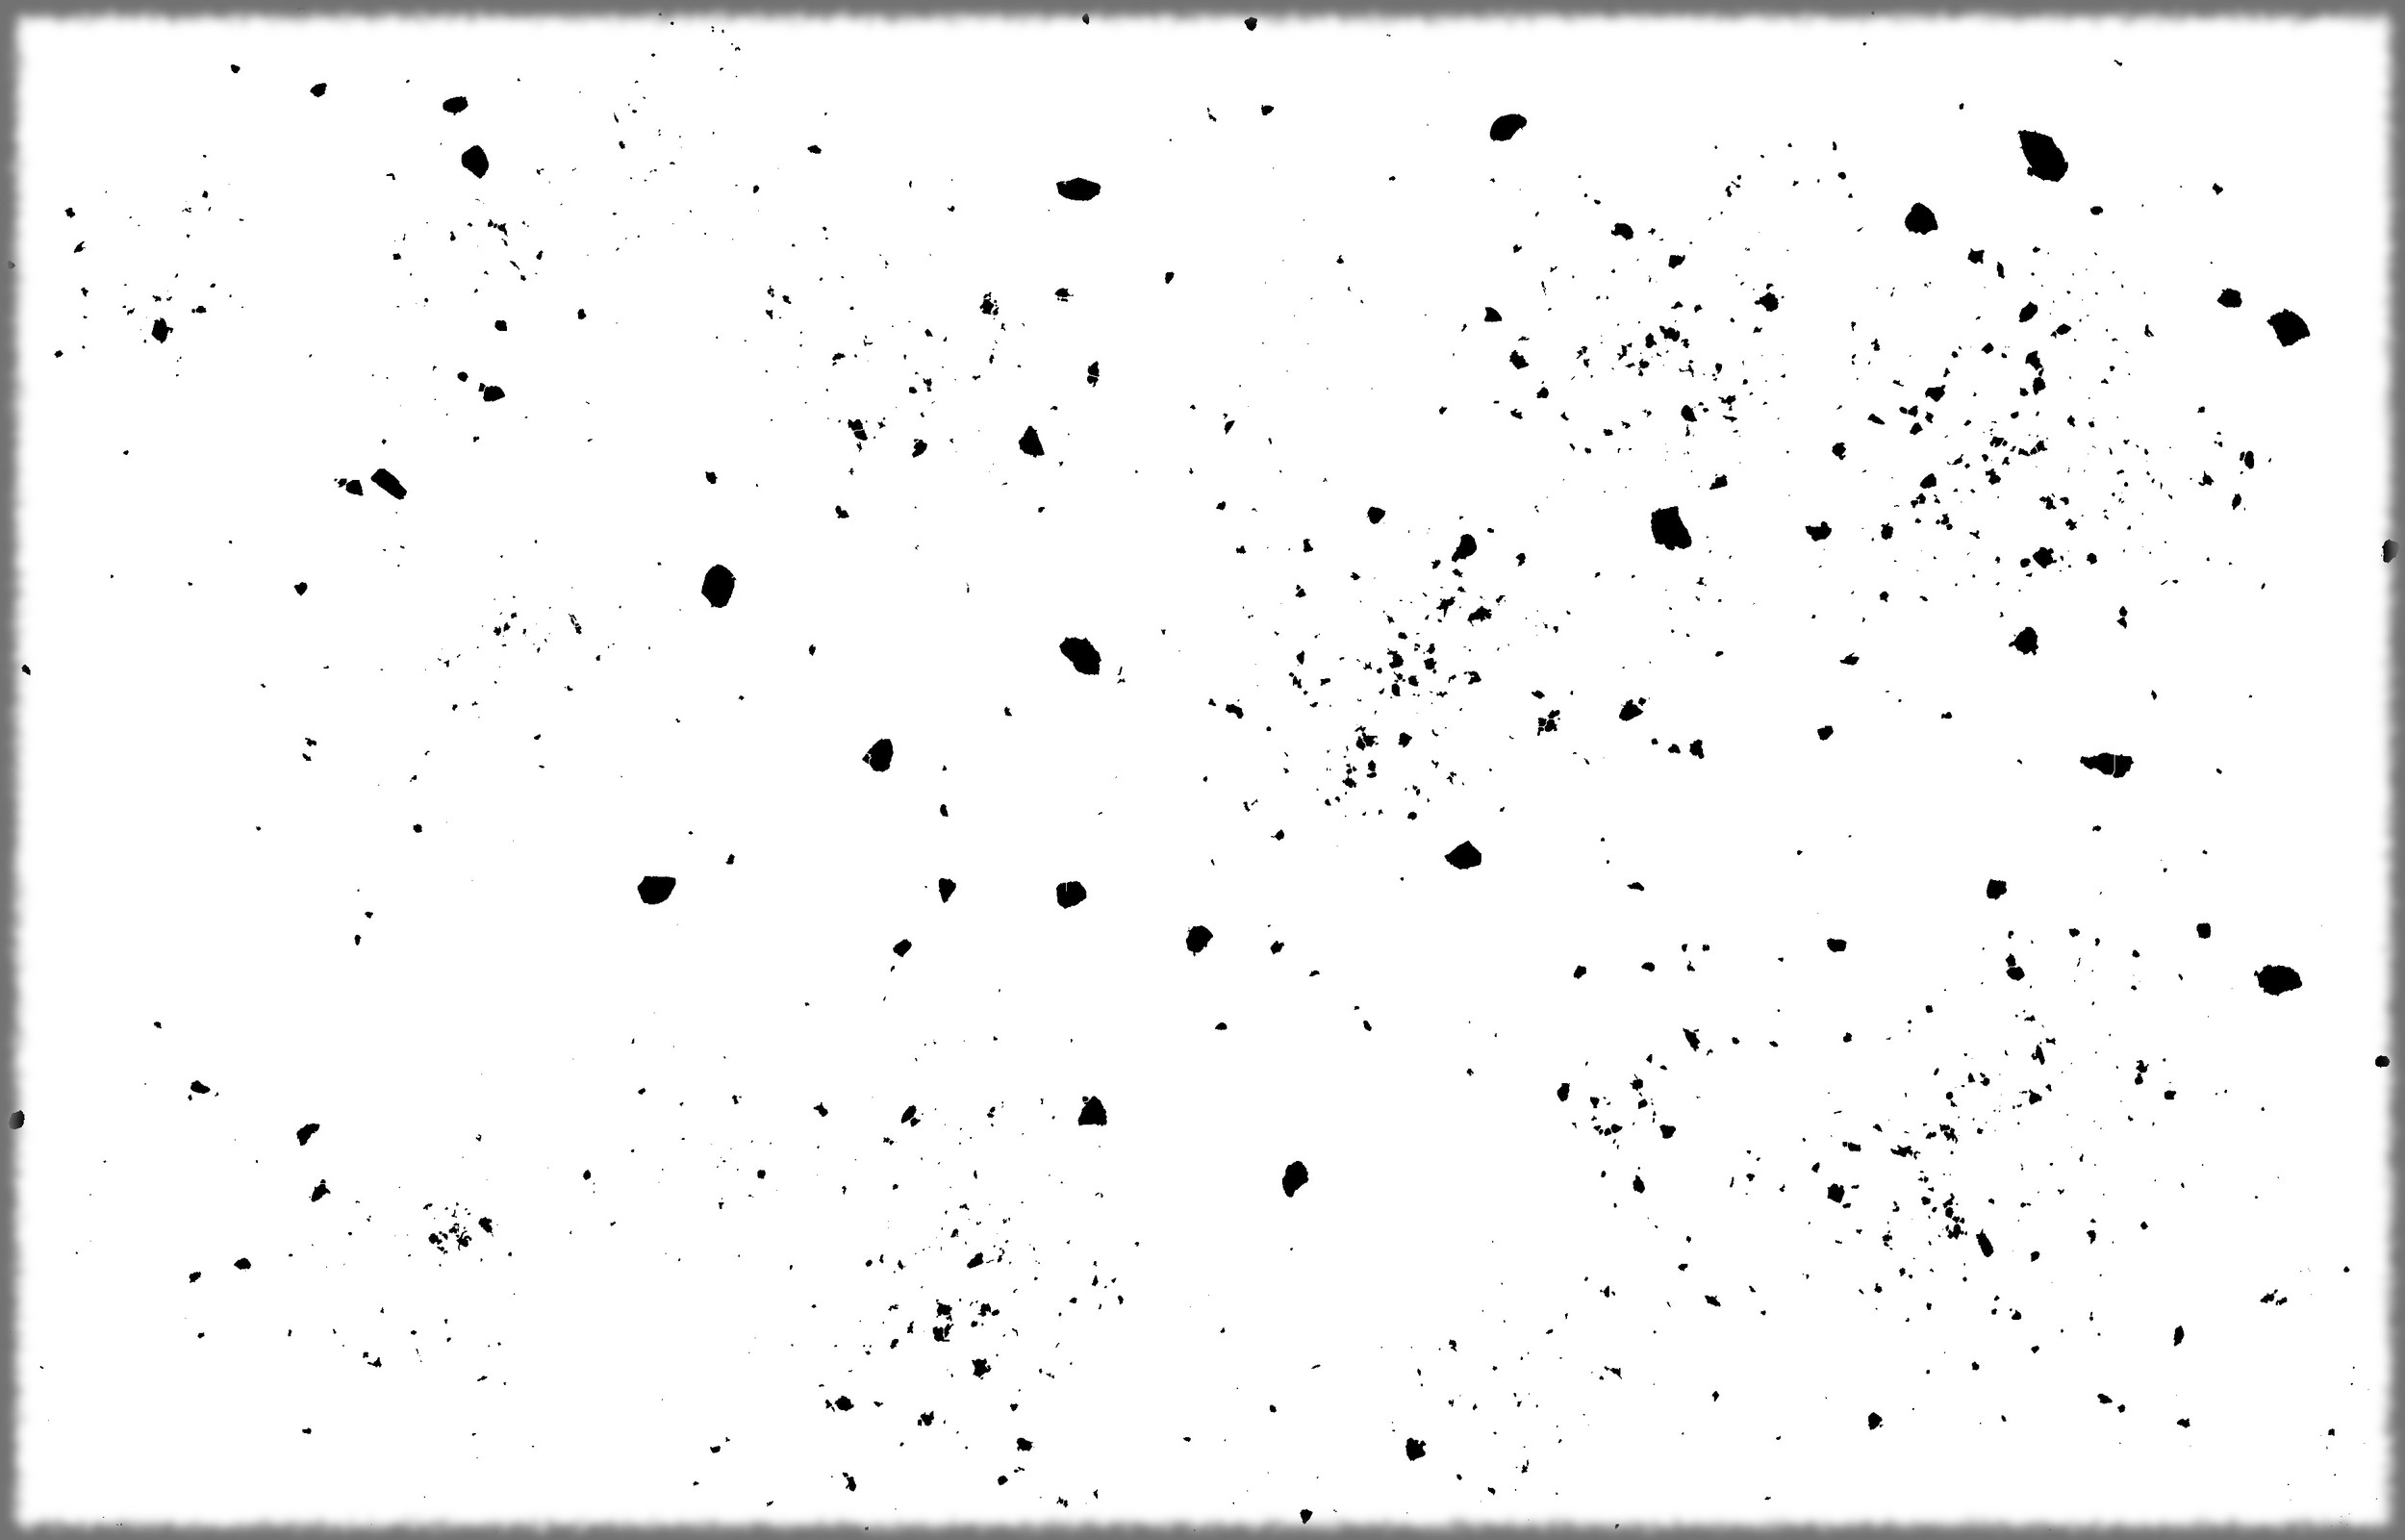
Binary Image of Coffee Grinds
I use grind analysis to calculate a mean grind size which then can be used to estimate the amount of coffee needed when brewing my coffee. Without that knowledge, it is a guessing game as to how much coffee can be extracted from the bed of coffee grounds. The best way to visualize the analysis is to plot the grind size distribution of the particle volumes. Since the volume of a particle is not directly measured, an equivalent sphere with the same cross sectional area is used. From the grind size distribution an average grind size is determined as shown in the Particle Size Distribution graph below. The mean grind size was calculated to be 1.14 mm, much larger than what I had been estimating.
Something you need to get your head around is why only a few large grounds have such a huge impact on coffee extraction. The answer is based on the relationship those particles have to the mass of coffee we measure. And, the mass of coffee is proportional to the volume of the particles not the diameter. The affect of these large particles is huge because their mass gets magnified by an exponential factor of r3, where r is the particle radius.

Grinders have technical secrets that can be exposed by performing a grind analysis. The grinder that was analyzed above has some definite flaws as far as I am concerned. There is no definitive peak grind size and it exhibits a broad spectrum of sizes. How are these large chunks getting through the burr grinder? This could be a potential subject for a follow-on blog post but at this point let's expose those secrets and adjust our brew ratio accordingly. After correcting the brew ratio using my CoffeeNotes app, I got good results from my pour-overs even with the grinder's flaws.
How much Variation was Observed?
Because brewed coffee contains less than 2% extracted coffee, a small change in concentration will affect taste. There is a typical sweet spot in coffee strength from 1.2% to 1.4% which gives only a 0.2% range. The difference I saw from my two grinders had a variance of 0.15% in coffee strength and was easily detectable by taste.
There is another aspect to grind size distribution that needs to be discussed. Grind size will affect the brew time when using a percolation type brewer. In other words, how fast does the water percolate through the bed of grinds? This will be the subject of my next blog coming soon.